Measuring performance is critical to competitive success in almost anything worth doing, especially business. Borrowing a few words to boil down the importance of measuring construction performance: “What gets measured gets done.” Creating performance metrics starts by measuring your business’s inputs, outputs, processes, and projects. However, not all metrics are created equal. If you want to truly evaluate performance, you have to dive deeper. Buried within those metrics is the gold: Key Performance Indicators (KPIs). These are the “metrics that matter” – the ones that drive the desired (and undesired) business outcomes. Defining KPIs are relatively easy for an established industry with tried and true digital workflows, and decades of standardized data. For those new to the digital game, there often isn’t enough historical, company-wide data available to easily identify these KPIs or establish industry benchmarks to strive towards. Simply put: the definition of success is currently hard to identify. To help fill this gap and to identify new avenues for productivity, Autodesk commissioned Dodge Data and Analytics to find out where our industry may be headed, and perhaps should be headed, regarding KPIs and benchmarking.  Surveying just north of 200 construction and trade professionals, the study identified seven main categories where companies should be collecting data and seeing how their performance stacks up. Here are the seven categories, or areas of focus, Dodge Data surveyed: Problems Discovered in Construction Documents; Requests for Information (RFIs); Change Orders; Schedule; Safety/Inspections; Labor Productivity; and Quality and Close-out. The findings suggest that by adopting consistent (or repeatable) processes for construction project management, you can reduce risk and minimize downstream problems, improving performance.
 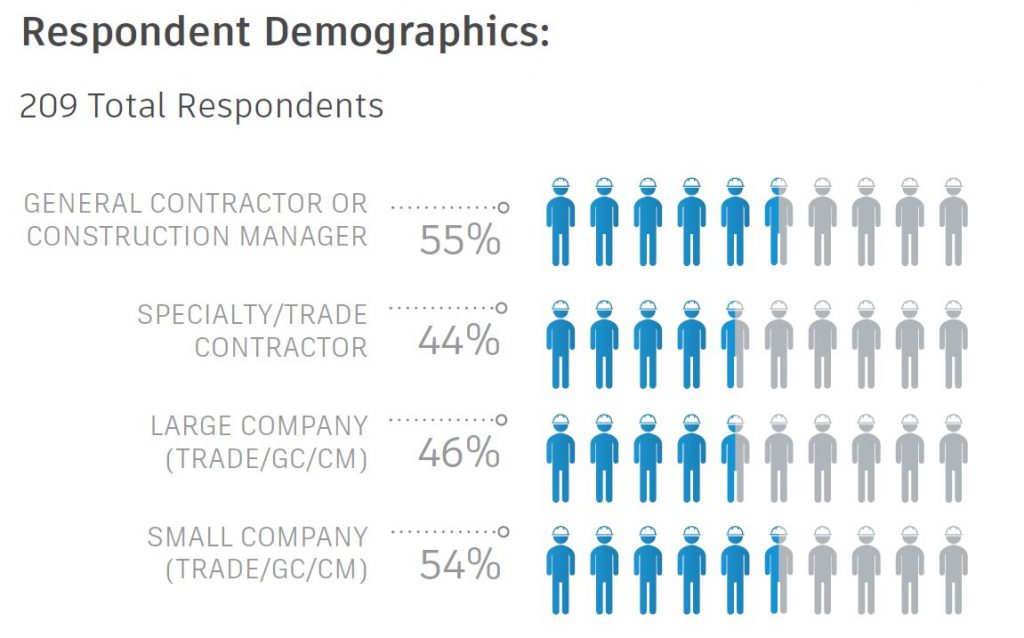 The survey informs us that adoption of best practices around these seven key activities is still relatively low, hovering just above 50 percent for those companies applying them to over half of their projects. However, the data also shows that the companies reporting frequent use of these practices assign a high value to them, confirming that they are seeing improvements in project performance through their implementation, and ultimately, the ROI. Who are these higher-frequency companies? The answer may surprise you. What our survey found is that while larger companies seem most willing to try new technologies, they seem most willing to do so on a one project or on a pilot basis. Yet, it is the smaller contractors who are gathering data at a higher frequency. Why? Perhaps it is because smaller companies are able to more easily create policies and practices for technology use, and to have them implemented across the enterprise more rapidly. But why don’t we have industry benchmarks today? One reason for the absence of benchmarks across construction is the lack of clean centralized data necessary to accurately quantify performance across all projects. All contractors using digital technology to manage their construction projects are generating data, however, many say they lack a single place to aggregate that information and use it in a meaningful way. Having the ability to capture and analyze operational data, such as requests for information (RFIs) and change orders, not only provides useful context, but also allows contractors to understand patterns of issues in their building processes. Correlating operational data to financial outcomes enable proactive adjustments to ensure better outcomes. The comprehensive analysis of this data across the industry will help improve business outcomes in the form of better quality, improved profitability and decreased risk. An example of an industry metric is the Experience Modifier Ratio (EMR) for safety in the construction industry. Once the formula became clear, contractors competed hard to ensure their EMRs were as low as possible. Owners joined in by setting minimum EMR requirements to qualify for bidding their work. No other event contributed more significantly to the reduction in frequency and severity of injuries than establishing an objective industry metric.
 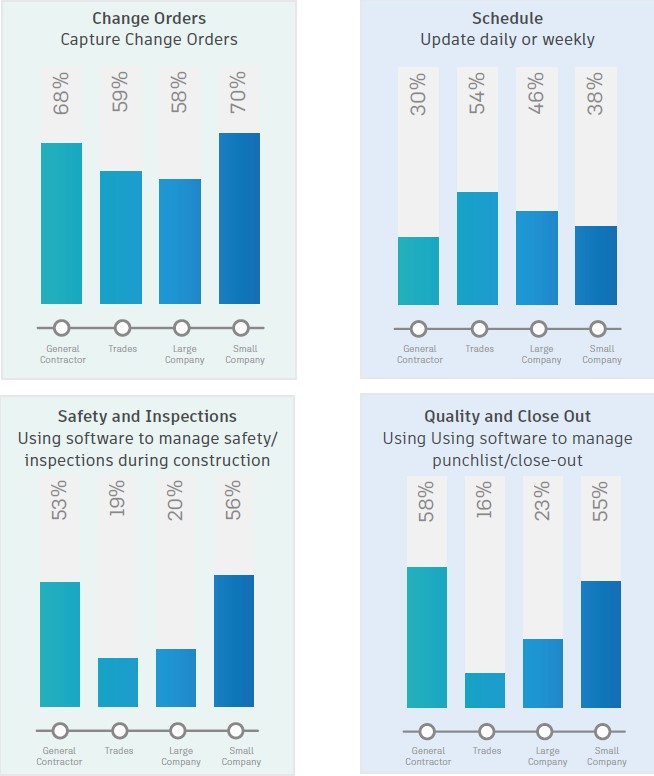 Once you understand your own KPIs, and the outcomes they drive, you can start benchmarking your performance against the rest of the industry. Very few can make sense of the growing value of information like industry-outsider-turned-construction-insider, Jit Kee Chin, Suffolk’s new Executive Vice President and Chief Data Officer. Prior to her role as CDO with Suffolk, Jit Kee spent 10 years’ experience at McKinsey & Co. advising clients on the use of data. Jit Kee sees a value of benchmarks for the industry, recognizing that “benchmarking productivity, safety, change orders, and other critical areas of the building lifecycle will become less of an option and more of a requirement to win bids and understand your place against the competition. Prospective clients will come to expect access to KPI-based performance data and use that information to make hiring and contract decisions.” While it’s important to use KPIs to see how you stack up against the competition, it’s more critical to first set benchmarks within your own organization. This will not only help maximize company profits, but also contribute towards your goal of creating a safe environment for your workforce while continuing to deliver high quality projects to your clients. Download our new KPIs in Construction ebook to learn more about the survey and where you measure up against your competition.